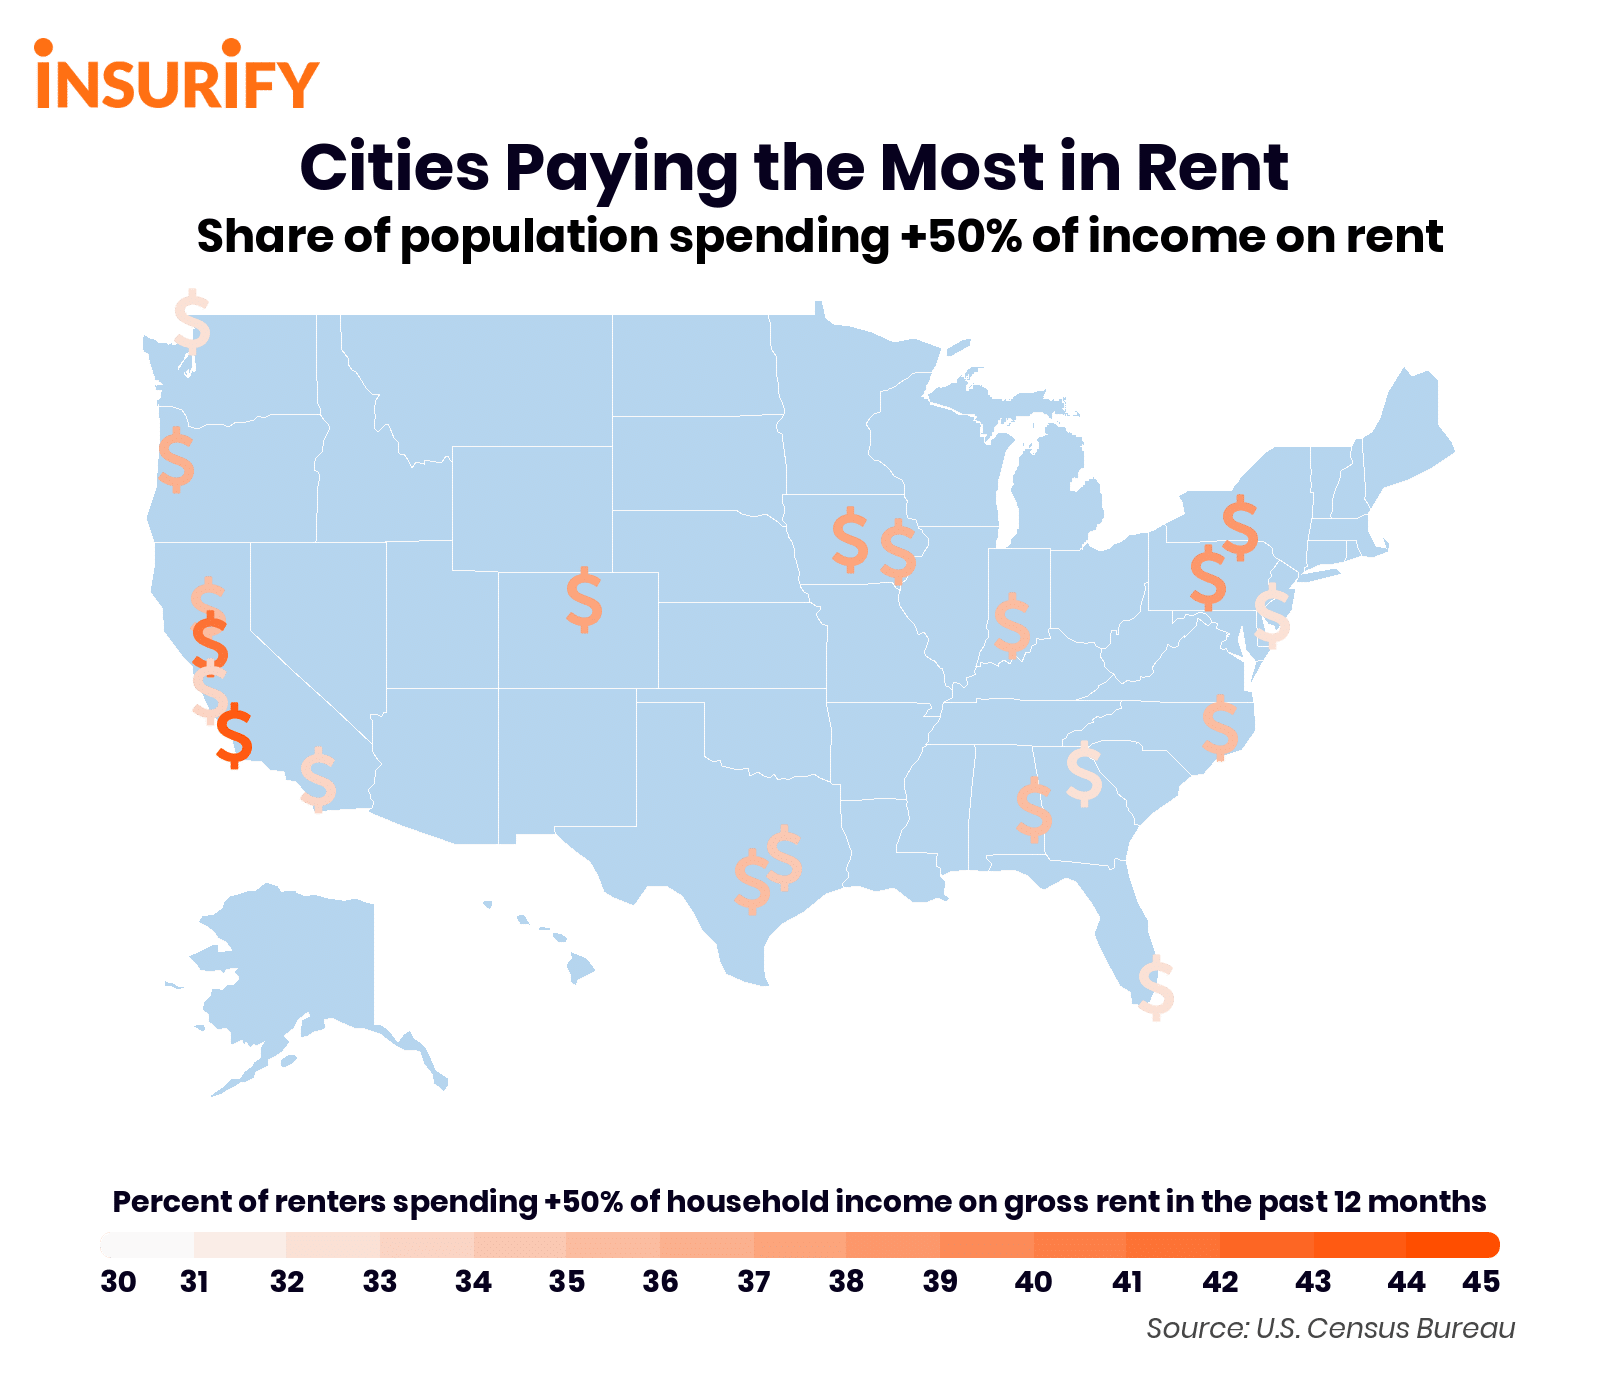
These Cities Are Paying the Most in Rent
The pandemic has upended the world as we know it in nearly every aspect of our lives — our jobs, schools, and social lives have had to drastically change to fit the new normal. With the unemployment rate at a historic high, paired with legally mandated stay-at-home orders, many Americans have found themselves in a difficult situation, as paying rent has never been more difficult yet necessary.
In late March and early April, many cities across the U.S. instituted measures such as eviction moratoriums and rent freezes to accommodate these extenuating circumstances. Under an eviction moratorium, landlords are prevented from evicting tenants during this public health emergency (and thirty days beyond its declared end). Rent freezes ensure that rent prices cannot increase. However, as more cities continue to re-open, these housing security measures are set to end, even as they have helped many families maintain a safe place to live. If cities with copiously high rent burdens allow their eviction moratoriums to expire, they may face a homelessness crisis compounding on an already quickly-spreading outbreak.
The national discourse around rent affordability may be under the national spotlight due to stay-at-home orders, but these issues predate the pandemic and will continue to affect Americans after. According to the United States Census Bureau, both average rent prices and the number of rental properties have followed an upward trajectory within the past decade — between 2012 and 2016, four out of five U.S. metropolitan areas experienced rent increases, and the national average for median gross rent rose by $21. One potential factor in this trend is the housing market crash in 2008, which had widespread ripple effects on the real estate market and overall housing costs. However, as the quarantine era has clearly shown, the ability for many people to afford their rent is erratic, especially given that the American economy has yet to fully recover to its pre-pandemic state. The conversation around housing access in the U.S. should continue after the eviction moratoriums and rent freezes end. To that end, the data and research team at Insurify studied rent and demographic data to determine the top twenty cities whose residents are paying the most in rent, proportional to their income.
Insights
- National averages. Across cities in the United States, the average share of renters paying 50% or more of their household income on rent was 23.61 percent. The median gross rent was $966.27 per month. The percent of city populations below the poverty line was 16.67 percent.
- Greater affordability. The U.S. cities with the lowest share of renters paying 50% or more of household income on rent were Mauldin— Simpsonville (SC), Paso Robles—Atascadero (CA), and Casper (WY) at 12.34, 13.49, and 14.18 percent, respectively.
- Most, but not all, have high poverty rates. While the majority of the cities on this list have a greater-than-average percentage of their population living below the poverty line, not all cities on this list follow that trend. Notably, Miami (FL), Vineland (NJ), and Watsonville (CA), all have a lower-than-average proportion of their population living below the poverty line. In fact, Miami’s is 9 percent lower than the national average. That said, many of these cities’ shares of impoverished citizens greatly exceed the national average. San Marcos (TX) has 50 percent more of its population under the poverty line than the national average, at 32.8 percent.
- Big city dreams? Interestingly, many notoriously expensive cities such as New York City, Los Angeles, San Francisco, and Seattle, did not make the list. An explanation for this phenomenon is the relative wealth of those cities that are always lauded to have such high rents. Many of the aforementioned cities are home to lucrative industries such as finance, entertainment, and tech. While the median rent may be higher than average, the higher volume of wealth held by city residents means that there are smaller proportions of the population where rental prices consume 50% or more of a renter’s income. The trend of gentrification in these cities, or how many former residents are being priced out by wealthier newcomers, can also account for this finding.
Methodology
The data and research team at Insurify, a home insurance quotes comparison site, referred to data from the American Community Survey by the United States Census Bureau to determine the twenty cities paying the most in rent. In this study, cities were designated by their status as an urbanized area by the U.S. Census Bureau. The U.S. Census Bureau defines “urbanized area” as a densely populated urban territory that encompasses 50,000 or more people.
The share of renters paying 50% or more of household income on rent was calculated by taking city-level estimates of renters paying 50.0 percent or more of household income on gross rent in the past 12 months compared to the total population of renters. Median gross rent and the percent of the population below the poverty line were also taken from the American Community Survey’s most recent calculations. The U.S. Census Bureau measures poverty by subtracting the poverty threshold, or the minimum level of income deemed adequate for a family of a particular size, from the total household income, inclusive of all family members earning an income for that particular family unit. If a family’s total income is less than their designated poverty threshold, they are considered to be under the poverty line.

U.S. Cities Paying the Most in Rent
20. Bellingham, WA
- Share of Renters Paying 50%+ of Household Income on Rent: 31.84%
- Median Gross Rent: $1,012
- Percent of Population Below Poverty Line: 18.30%
19. Athens-Clarke County, GA
- Share of Renters Paying 50%+ of Household Income on Rent: 31.90%
- Median Gross Rent: $849
- Percent of Population Below Poverty Line: 28.80%
18. Miami, FL
- Share of Renters Paying 50%+ of Household Income on Rent: 32.02%
- Median Gross Rent: $1,299
- Percent of Population Below Poverty Line: 15.30%
17. Vineland, NJ
- Share of Renters Paying 50%+ of Household Income on Rent: 32.03%
- Median Gross Rent: $988
- Percent of Population Below Poverty Line: 15.90%
16. Watsonville, CA
- Share of Renters Paying 50%+ of Household Income on Rent: 32.65%
- Median Gross Rent: $1,385
- Percent of Population Below Poverty Line: 16.30%
15. Hemet, CA
- Share of Renters Paying 50%+ of Household Income on Rent: 33.44%
- Median Gross Rent: $1,099
- Percent of Population Below Poverty Line: 20.40%
14. College Station — Bryan, TX
- Share of Renters Paying 50%+ of Household Income on Rent: 34.39%
- Median Gross Rent: $932
- Percent of Population Below Poverty Line: 27.50%
13. Greenville, NC
- Share of Renters Paying 50%+ of Household Income on Rent: 34.50%
- Median Gross Rent: $788
- Percent of Population Below Poverty Line: 25.90%
12. Chico, CA
- Share of Renters Paying 50%+ of Household Income on Rent: 34.54%
- Median Gross Rent: $1,048
- Percent of Population Below Poverty Line: 23.20%
11. Auburn, AL
- Share of Renters Paying 50%+ of Household Income on Rent: 35.00%
- Median Gross Rent: $793
- Percent of Population Below Poverty Line: 29.40%
10. Bloomington, IN
- Share of Renters Paying 50%+ of Household Income on Rent: 35.14%
- Median Gross Rent: $893
- Percent of Population Below Poverty Line: 29.20%
9. San Marcos, TX
- Share of Renters Paying 50%+ of Household Income on Rent: 35.41%
- Median Gross Rent: $990
- Percent of Population Below Poverty Line: 32.80%
8. Iowa City, IA
- Share of Renters Paying 50%+ of Household Income on Rent: 35.80%
- Median Gross Rent: $972
- Percent of Population Below Poverty Line: 21.10%
7. Corvallis, OR
- Share of Renters Paying 50%+ of Household Income on Rent: 35.91%
- Median Gross Rent: $1,018
- Percent of Population Below Poverty Line: 25.00%
6. Ames, IA
- Share of Renters Paying 50%+ of Household Income on Rent: 36.74%
- Median Gross Rent: $902
- Percent of Population Below Poverty Line: 28.00%
5. Boulder, CO
- Share of Renters Paying 50%+ of Household Income on Rent: 37.13%
- Median Gross Rent: $1,465
- Percent of Population Below Poverty Line: 19.30%
4. State College, PA
- Share of Renters Paying 50%+ of Household Income on Rent: 37.73%
- Median Gross Rent: $1,026
- Percent of Population Below Poverty Line: 27.80%
3. Ithaca, NY
- Share of Renters Paying 50%+ of Household Income on Rent: 37.75%
- Median Gross Rent: $1,179
- Percent of Population Below Poverty Line: 29.70%
2. Davis, CA
- Share of Renters Paying 50%+ of Household Income on Rent: 40.84%
- Median Gross Rent: $1,442
- Percent of Population Below Poverty Line: 30.40%
1. San Luis Obispo, CA
- Share of Renters Paying 50%+ of Household Income on Rent: 43.43%
- Median Gross Rent: $1,459
- Percent of Population Below Poverty Line: 30.80%
If you have questions or comments about this article, please contact insights@insurify.com.
More From 107.7 WGNA


![Firefighter tells GNA: ‘Ray’s House Is a Total Loss’ [Audio]](http://townsquare.media/site/81/files/2020/08/Rachel-Ray-Fire-1.jpg?w=980&q=75)